Integration of Charts and Graphs
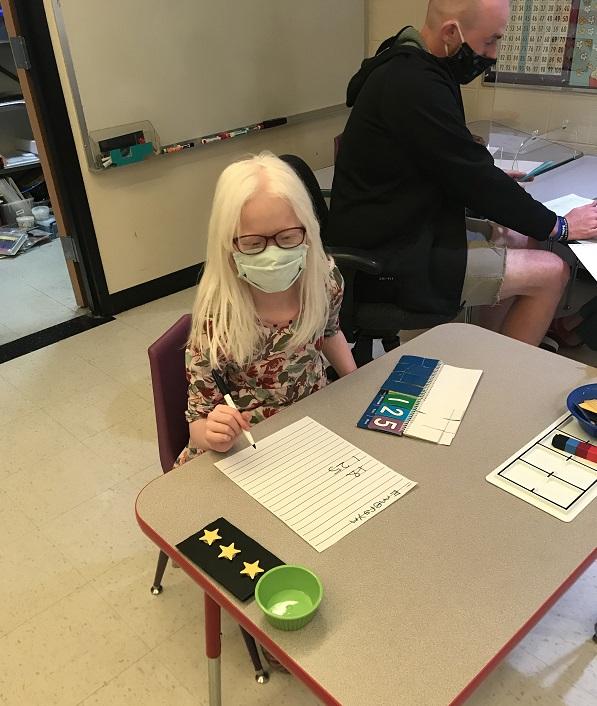
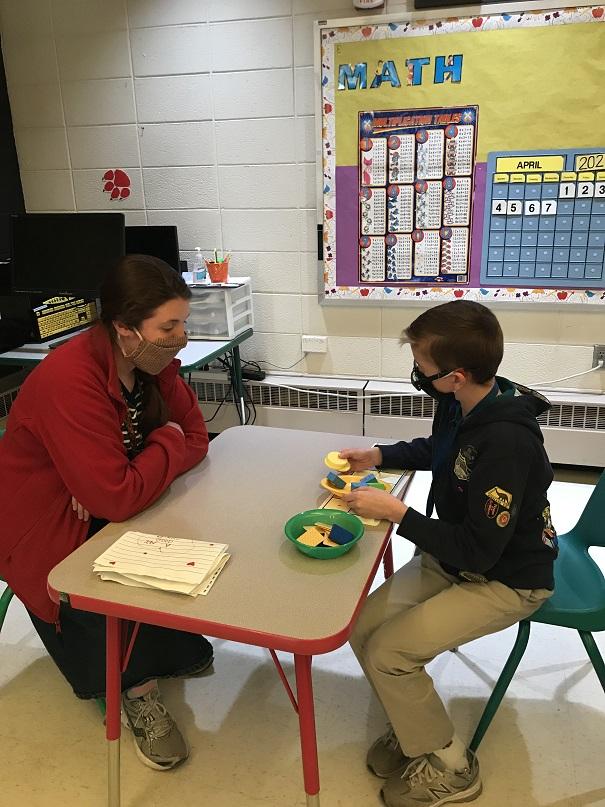
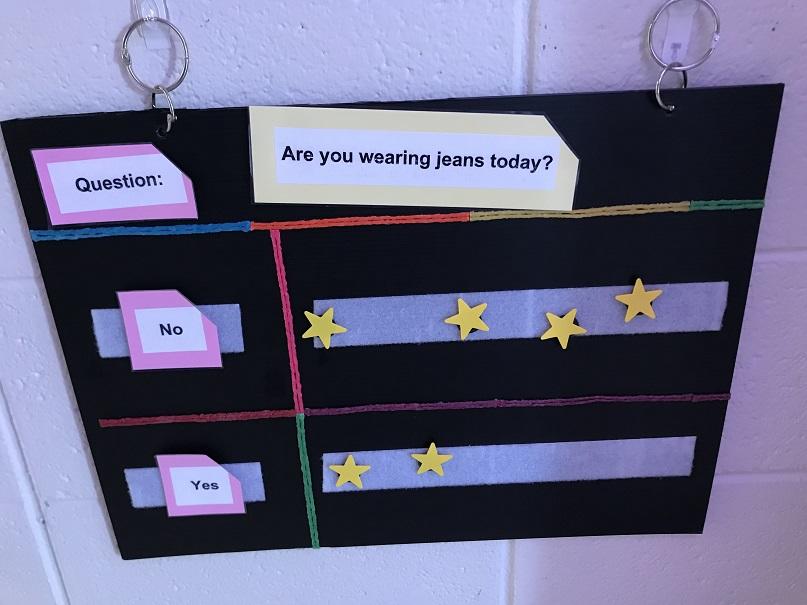
Charts and graphs are very visual. Those with vision can quickly glance at a chart or graph and interpret data almost immediately. One of our many missions in the School for the Blind is to give our students as many opportunities as possible to experience, interpret, and explore a variety of ways to data collect and show information. Students explore charts and graphs in math class, vote on preferred stories in language arts, track the weather during calendar, and even get information about each other’s attire to help fill in the gaps and enrich their concept development.